Next: About this document ...
Up: An analysis of one
Previous: Bibliography
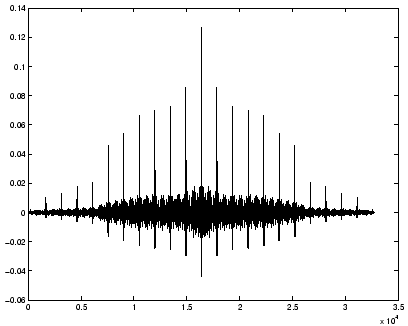
Figure 2:
The autocorrelation of  .
.
|
|
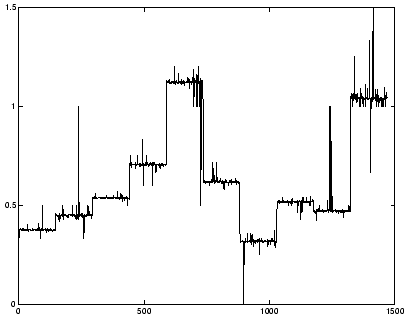
Figure 3:
The ratio of two successive periods of the mark.
|
|
Figure 4:
Output of our detection algorithm with  on the original song
  and its marked counterpart
  .
.
|
|
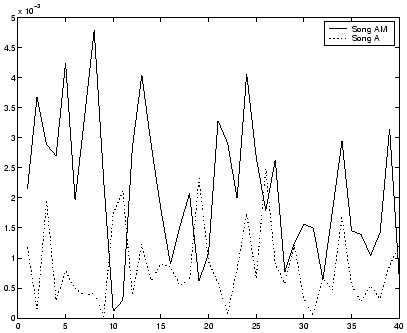
Figure 5:
Output of our detection algorithm with on our newly produced song  and its marked counterpart
  .
.
|
|
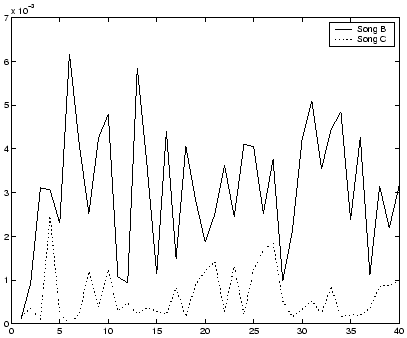
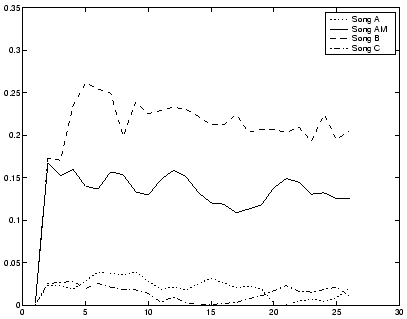
Figure 6:
Output of our detection algorithm with  on the four songs
  and .
and .
|
|
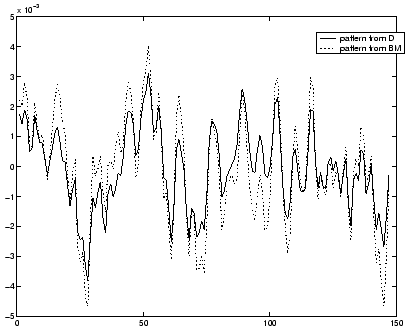
Figure 7:
Comparison between the mark recovered from the
difference  and the mark recovered from
  .
.
|
|
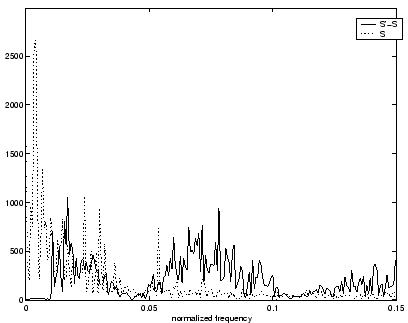
Figure 8:
Comparison between ![$ S[j]$](img14.png) and
and
![$ S'[j]-S[j]$](img15.png) in the
frequency domain. Note that most of the energy of is contained in the
low frequency
in the
frequency domain. Note that most of the energy of is contained in the
low frequency
|
|
Next: About this document ...
Up: An analysis of one
Previous: Bibliography
Julien Stern
2001-01-05